FALL 2020, THE EVIDENCE FORUM, WHITE PAPER
 J. Jaime Caro, MDCM, FRCPC, FACP Chief Scientist Evidera, a PPD business |  Debra Schaumberg, ScD, OD, MPH Vice President, Epidemiology, Strategic and Scientific Affairs Real-World Evidence Evidera, a PPD business |
Introduction
COVID-19 has posed major challenges to healthcare on a global scale, affecting everything from access to care, management of medical facilities, and effective recruitment for clinical studies. Drug developers have had to incorporate new approaches to site selection as they strive to accelerate timelines for SARS-COV-2 vaccines and COVID-19 therapeutic trials, as well as minimize interference of COVID-19 for site selection in non-COVID trials. For potential vaccines or COVID-19 treatments, sponsors need to find study sites in areas that are expected to see many cases during the patient enrollment period (in the case of treatments) or shortly thereafter (for vaccines). This is crucial for efficient trial execution. Conversely, studies in other therapeutic areas face challenges with patient recruitment due to sites being affected by COVID-19 and need to identify sites in locations with expected low incidence of COVID-19 cases over the study period.
Planning and site selection can be aided by an adaptable epidemiologic model that can produce accurate predictions customized to the specific locales of potential sites. Such a model, the Wave Assessment of coVid Epidemiology (WAVE), was developed to help inform site selection by considering the expected trajectory of the pandemic. WAVE is a process of deriving actionable forecasts for very specific local areas where potential sites are located. Using granular data, the observed caseloads are regularly updated for each small area of interest. These data are fit using a set of differential equations specifying ongoing sequences of exponential growth and decay. This hybrid model is then incorporated into a predictive simulation implemented in the Discretely Integrated Condition Event (DICE) framework. The forecasts for the time periods of interest are examined and interpreted considering each trial’s particulars.
Use of WAVE extends beyond site selection to inform hospital resource planning. The model can also help prepare for health technology assessment (HTA) submissions. In this whitepaper, we detail some of the use cases for the WAVE model.
Granular Data Obtained for WAVE
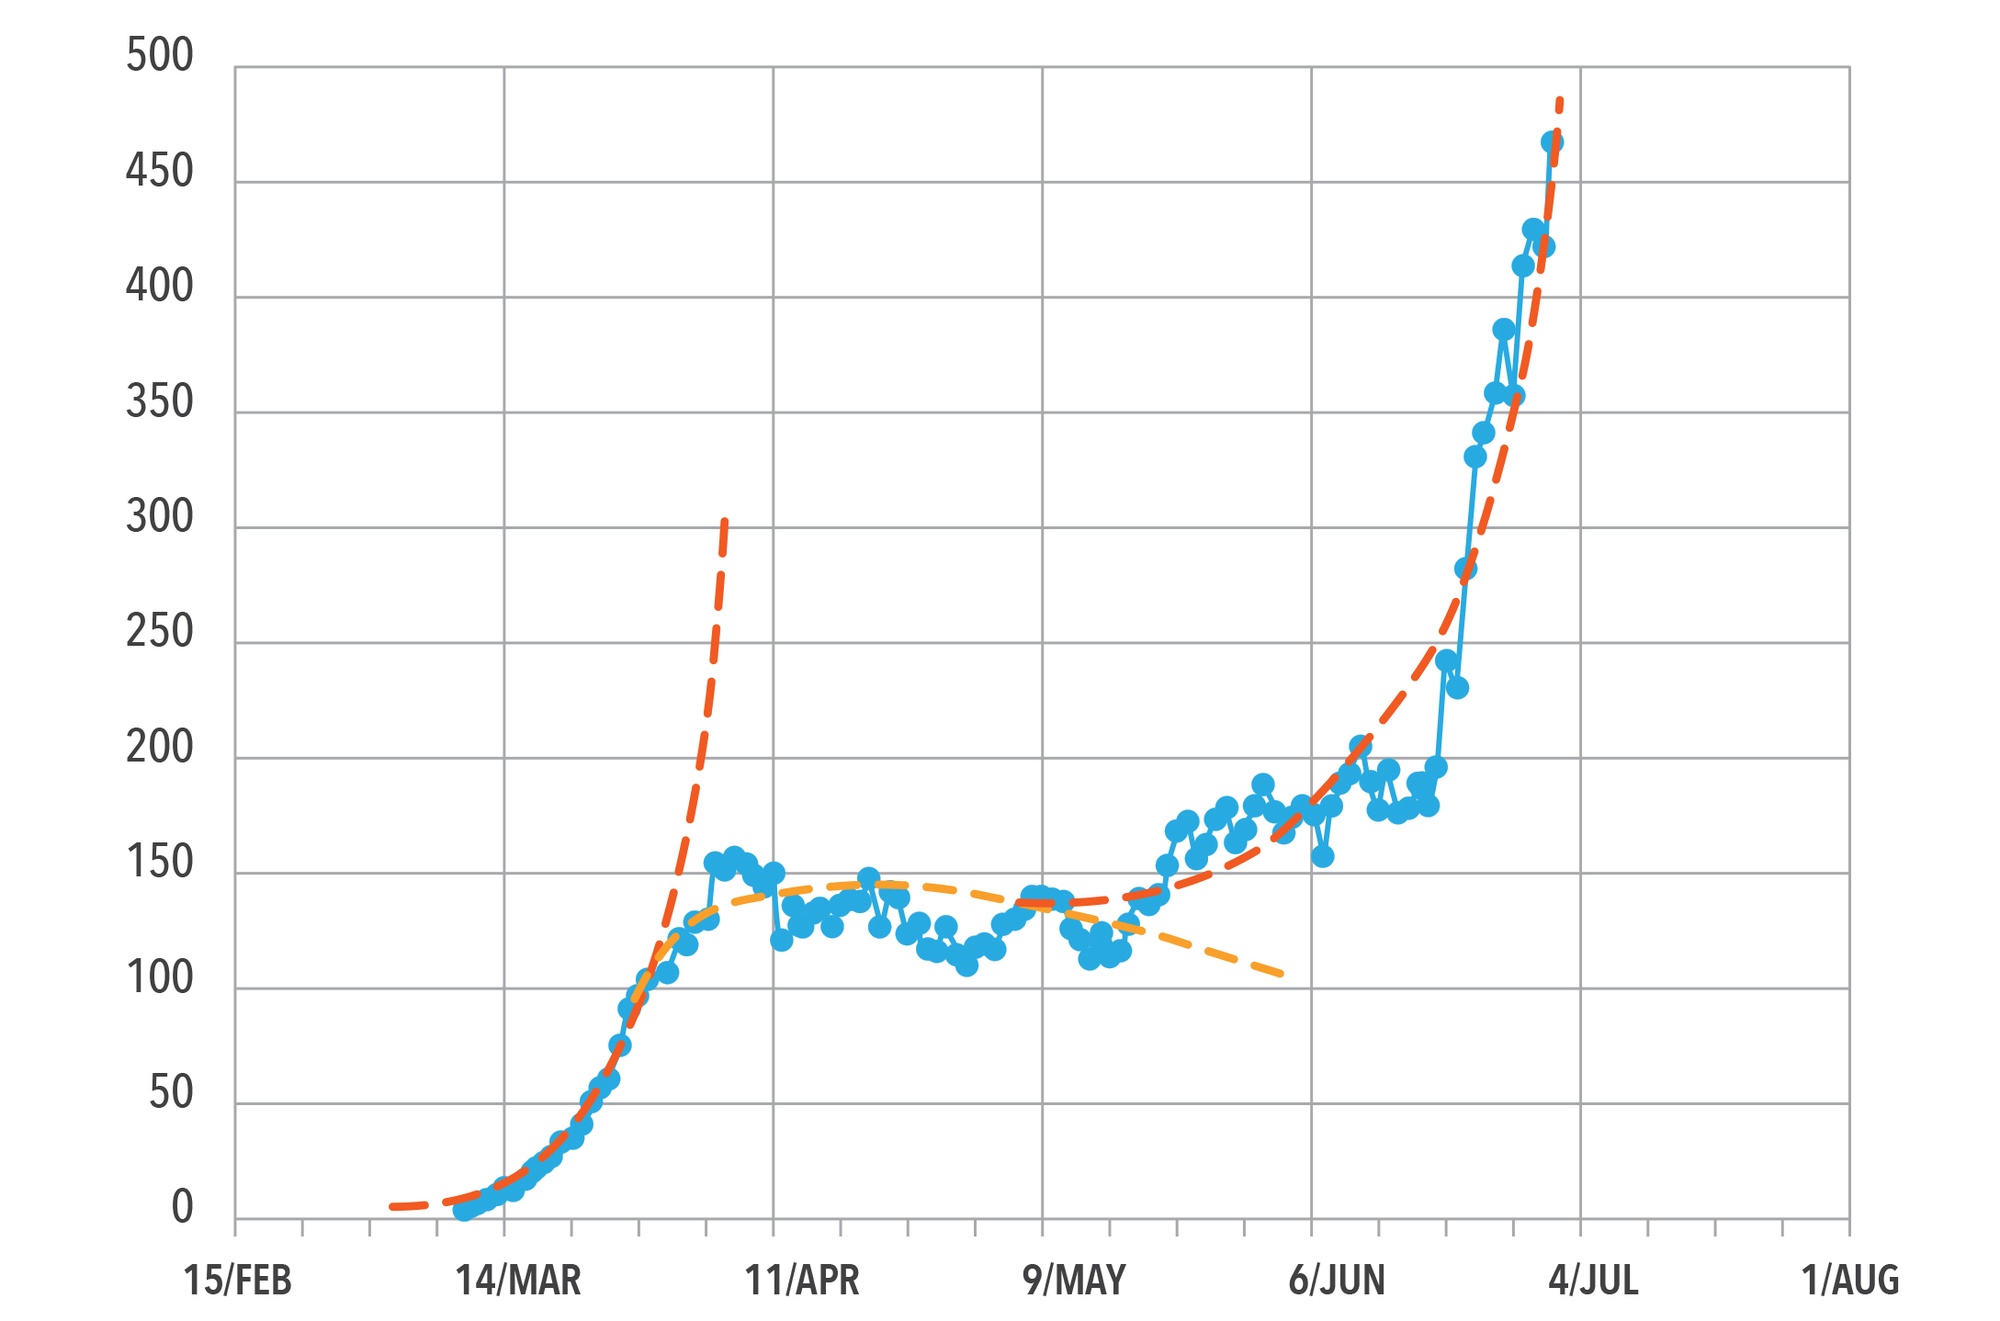
Observed case data for one potential site in the United State (US) are plotted in Figure 1. The blue dots represent local daily COVID-19 case counts from early March 2020 through the beginning of July 2020. The red and orange dashed lines indicate some potential fits of that site’s data. Given the variation in the data, one challenge is fitting in some detail without overfitting the short-term fluctuations due to data reporting practices and other factors. The final model blends ongoing growth (red lines) and decay (orange lines) portions to reflect the patterns without trying to replicate every up and down.
Figure 1. COVID-19 Cases Observed in the Catchment for a Particular Site from March to July 2020
Beyond Just Site Selection
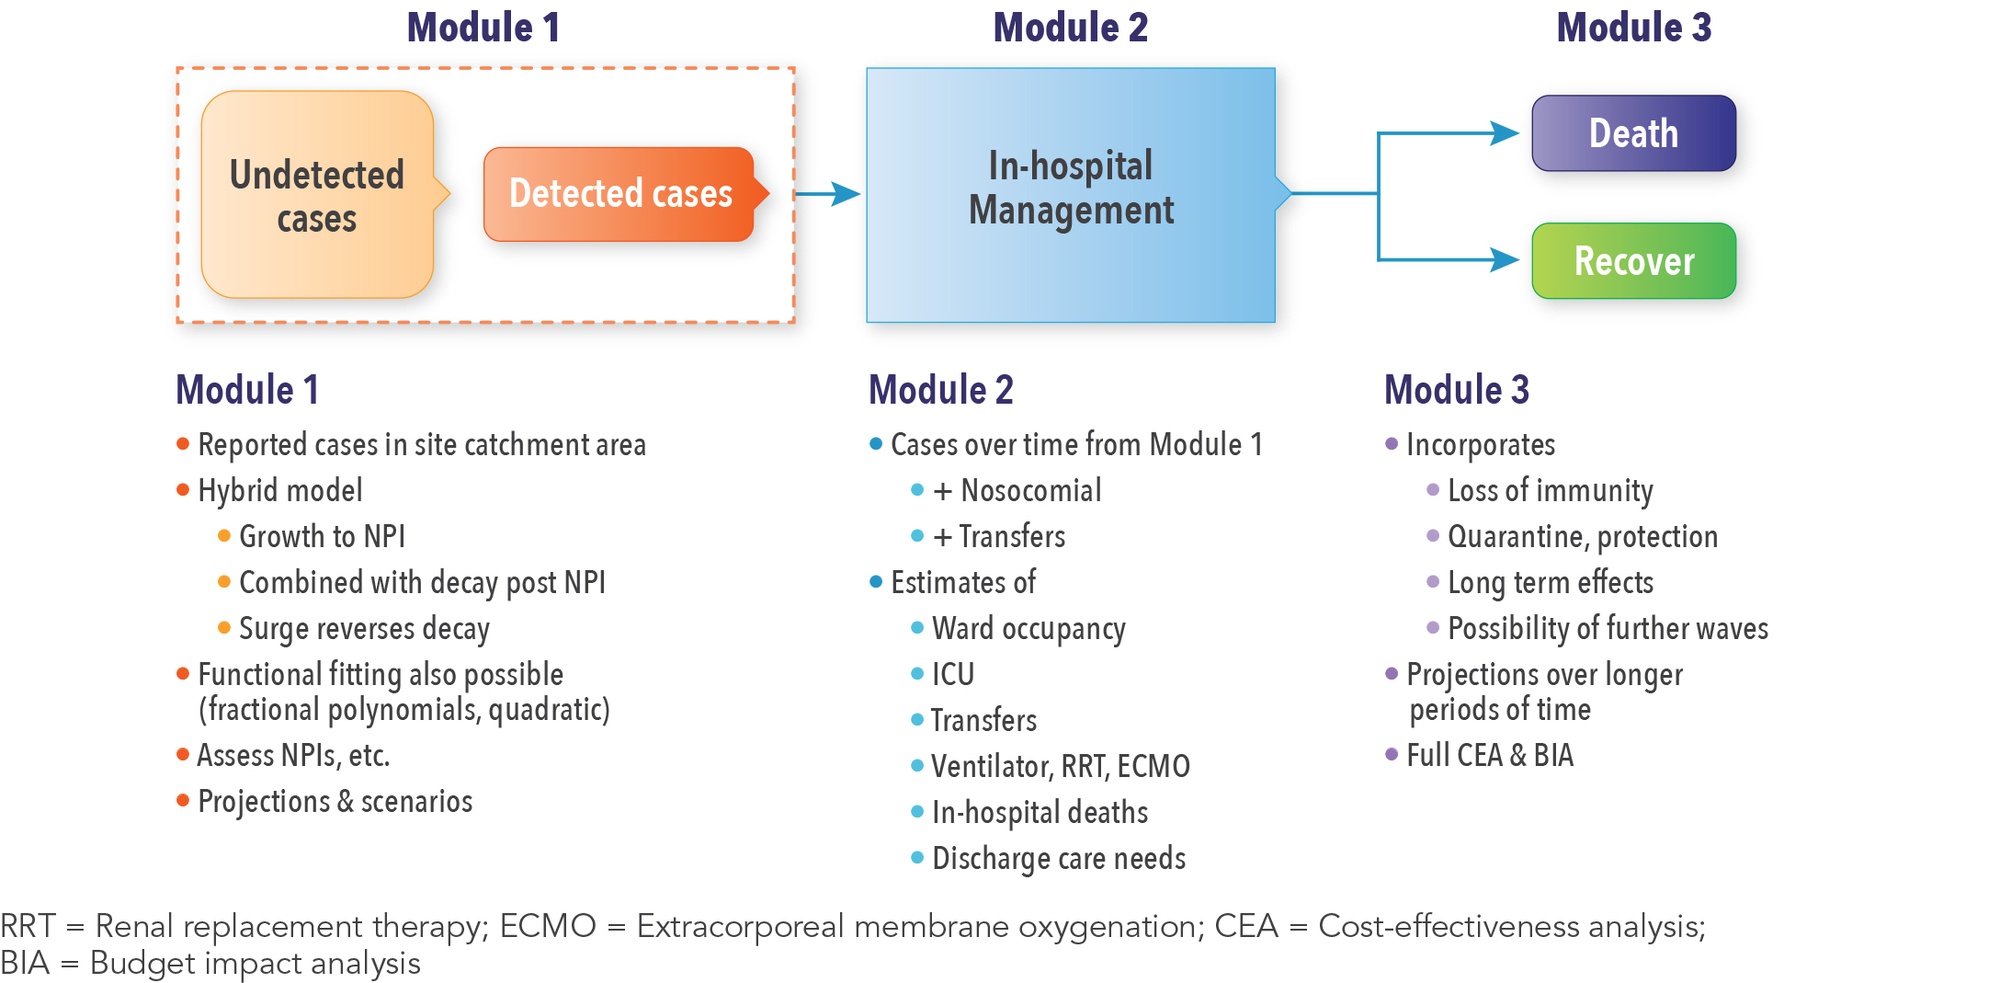
The full simulation consists of three modules. Module 1 is the epidemiologic module that uses the fitted equations to project the case load in each site’s catchment area. Users can examine the impact of starting nonpharmaceutical interventions (NPIs), when NPIs stop, and look at various scenarios. For example, a forecast might be needed to predict what happens if a locality institutes business closures for the second time. Information from Module 1 feeds into Module 2, which focuses on in-hospital management of patients. Module 2 takes a case from admission through to discharge or death. Module 3 addresses the longer term, including adverse consequences and their management. All of this is achieved within the DICE framework.
DICE Simulation
Developed and tested in 2016, the DICE approach conceptualizes the course of an illness in terms of the information (conditions) and the events when some of those conditions change. DICE simulations are specified entirely in a set of Excel tables which are very easy to read and understand; there’s no programming or special software needed.
DICE allows users to make forecasts, test different scenarios, and conduct sensitivity analyses. Users can select a site and use its fitted equations or input custom dates for when NPIs might be started or stopped. This information is used to select the transmission parameters that will control the growth and delay curves.
Real-World Applications for the WAVE Model
WAVE Model Enables Rapid Vaccine Development
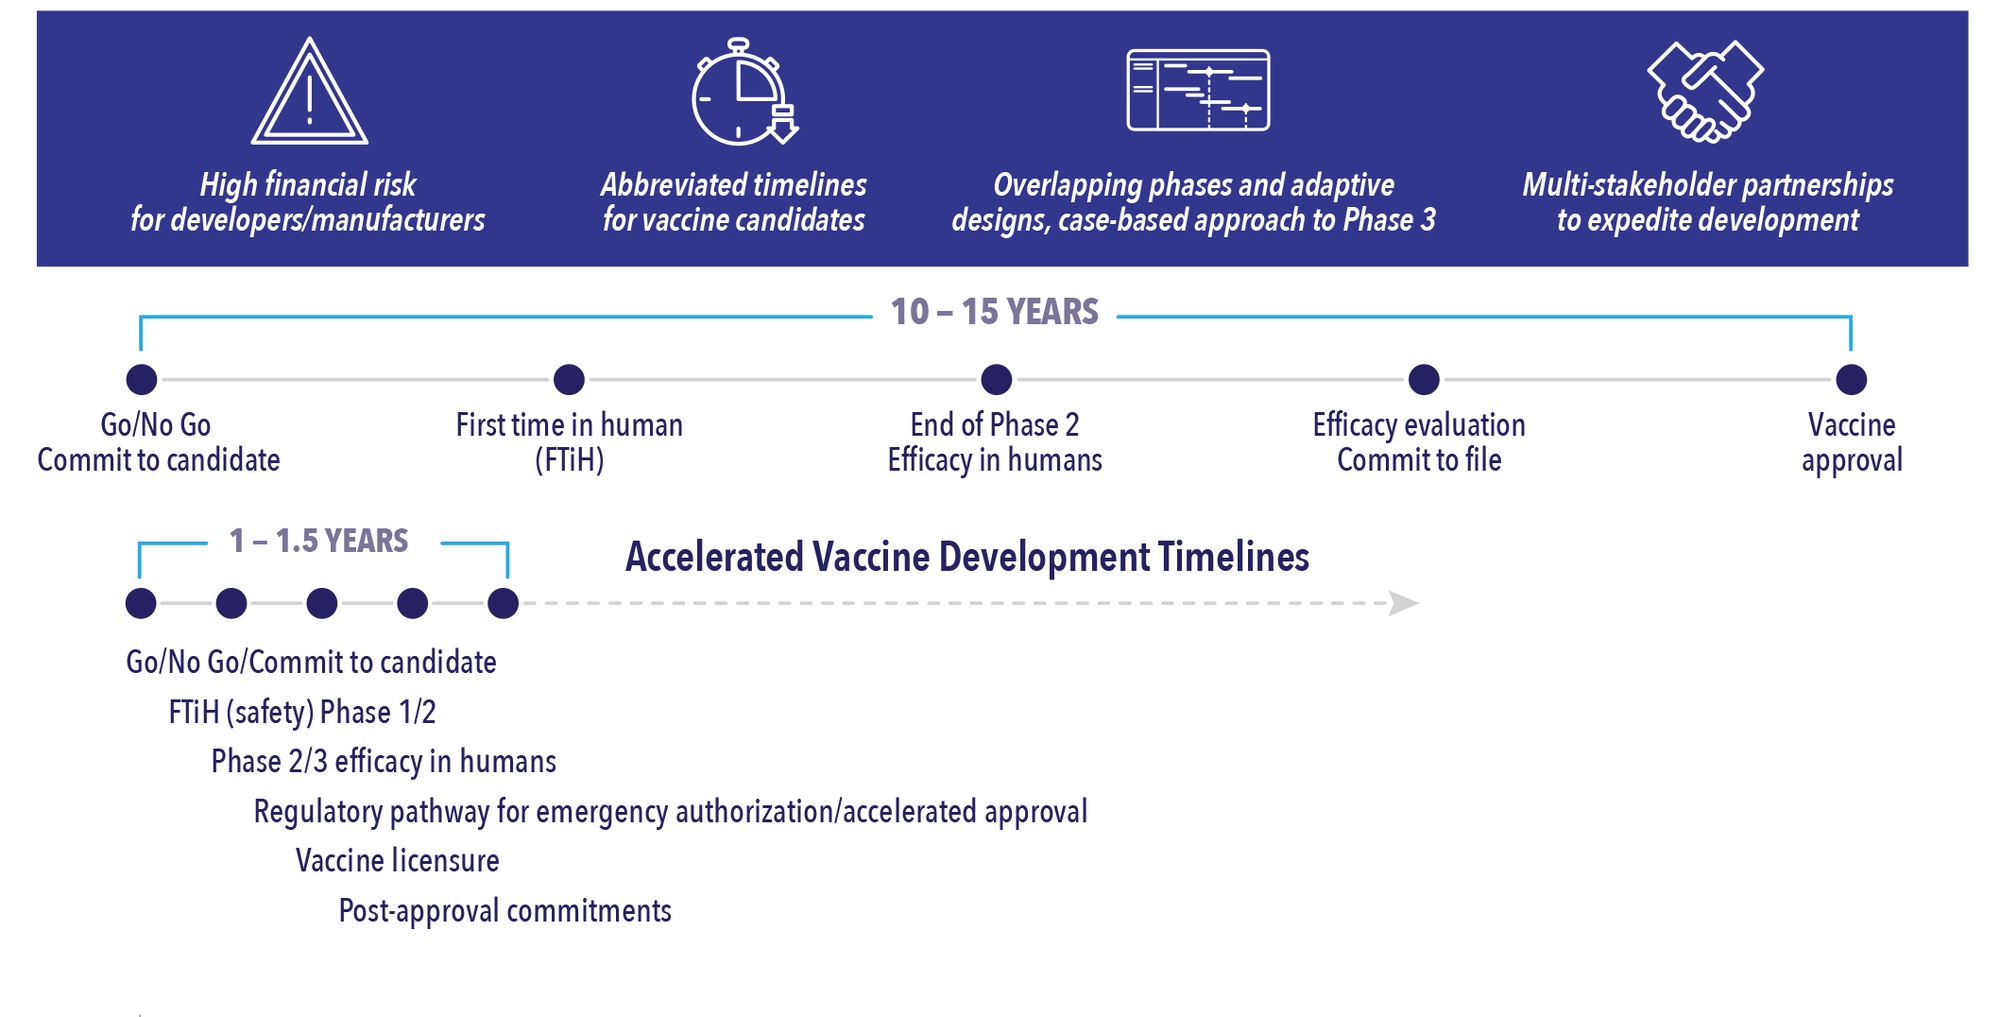
The vaccine development landscape for SARS-COV-2 is unique in history with its highly abbreviated timelines (See Figure 3). Where a traditional vaccine development program might take anywhere from 10 to 15 years, COVID-19 timelines are in the range of 1 to 1-1/2 years. This requires overlapping phases and adaptive designs. Most of the later phase vaccine programs are using an event-based approach (based on number of incident cases occurring post-vaccination) to power their Phase 3 studies.
There is high financial risk for developers and manufacturers to try to meet these timelines and be successful. Strong multi-stakeholder partnerships are expediting the development of these vaccine programs. While this is very positive, it poses additional challenges in terms of ensuring alignment across stakeholders in the trial design and implementation.
Module 1 Applications
Case Study
Site Selection
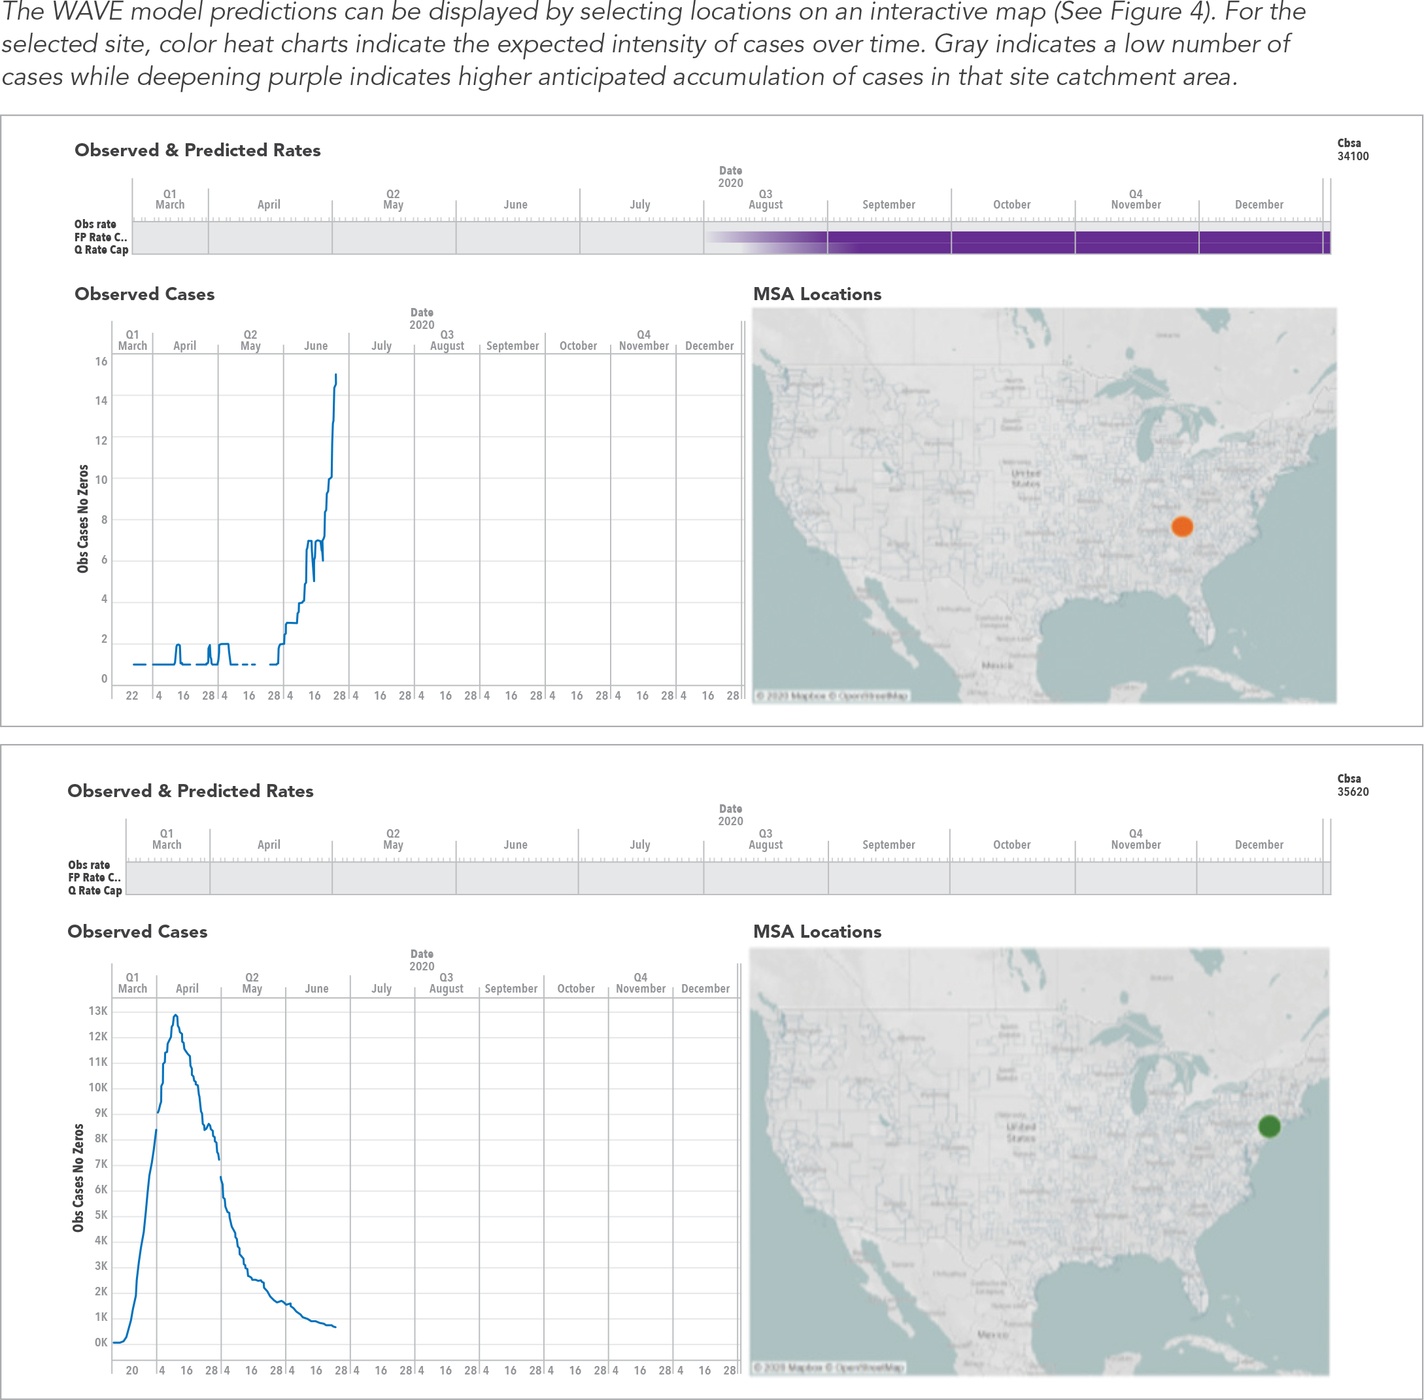
In the face of highly accelerated timelines, a company needed an enhanced, evidence-driven site selection approach for a large footprint SARS-COV-2 vaccine development program with many sites across the US. They were interested in selecting sites that had a large susceptible catchment population and a predicted rise in COVID-19 cases diagnosed over the trial period, but not too soon after the first dose was administered. A traditional site-based feasibility study was used to identify a large list of possible target sites. Using the WAVE model, the expected case numbers over time for each site’s catchment area were forecast for the time period of interest. Use of the WAVE model improved site selection—actionable predictions were instrumental in facilitating multi-stakeholder agreement for which sites would be selected and which sites would be eliminated. The WAVE model successfully predicted a surge in cases for many sites prior to the observed surge. In addition, the WAVE model predicted sites where the first wave was already closing, enabling the client to avoid these sites.
Case 2
Modeling the Impact of Public Health Interventions
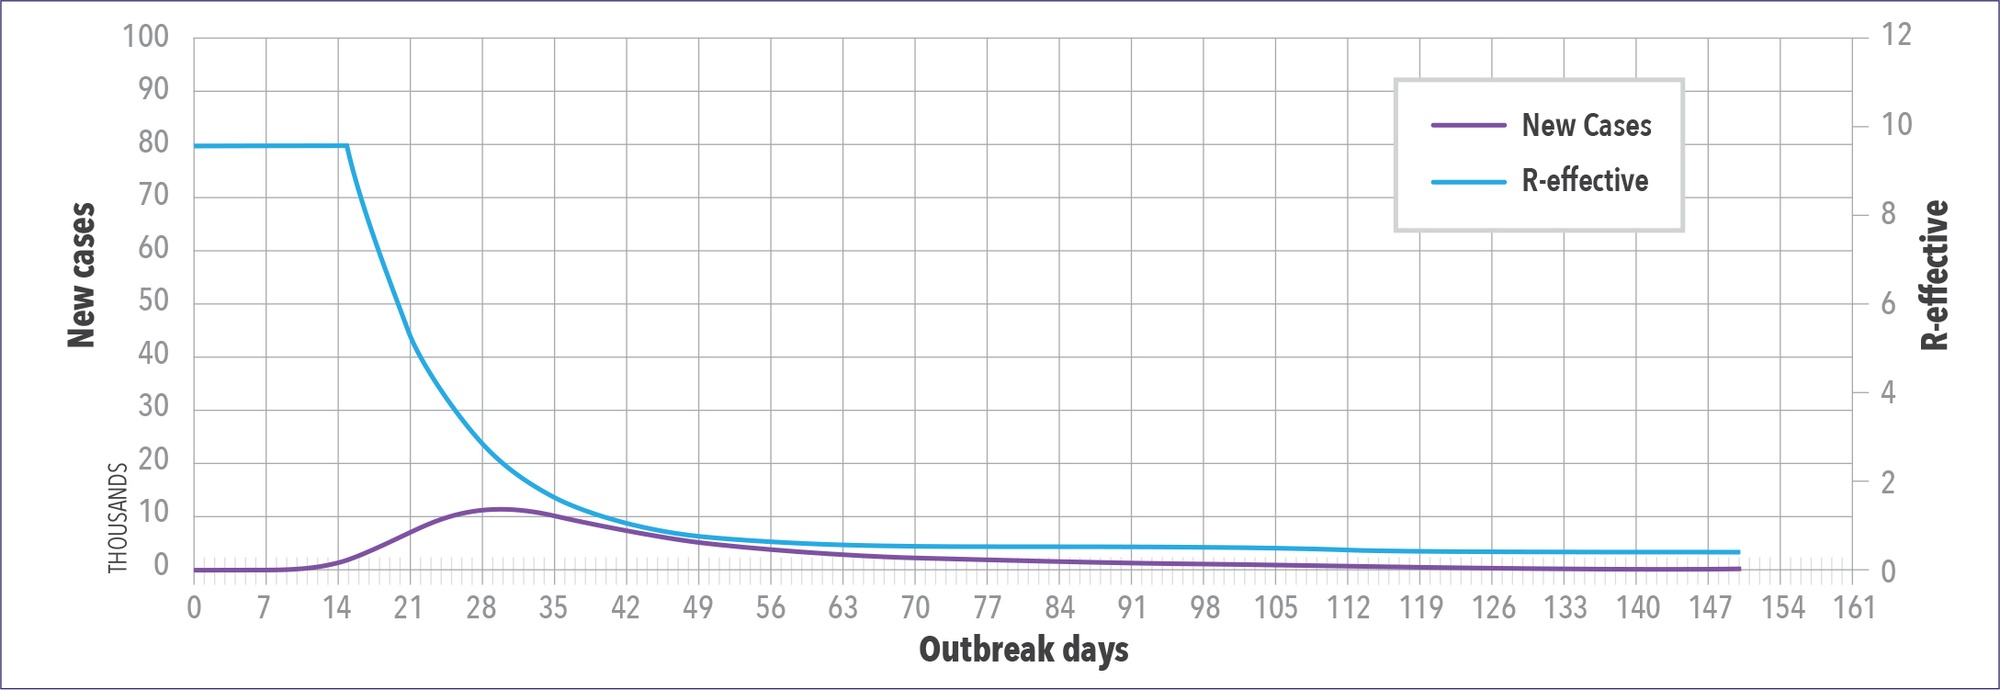
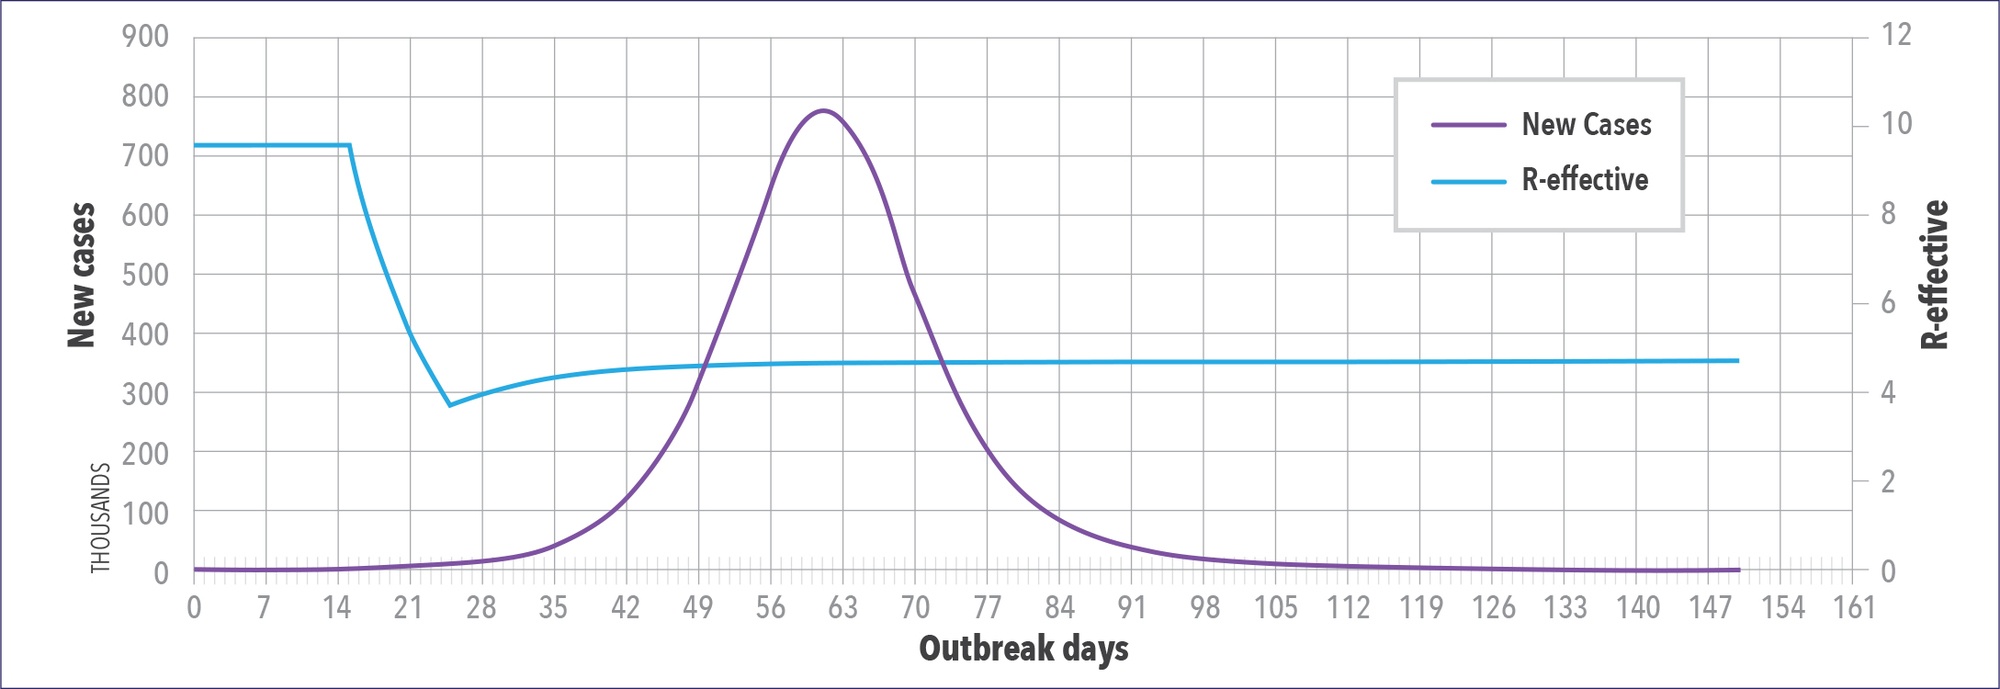
The WAVE model can also be used to predict the impact of public health interventions. Figure 5 shows a location that is doing a good job controlling the pandemic. Their R number (indicated in blue) is the reproduction number read off the right-hand axis. It drops below 1 approximately 42 days after they first saw 25 or more cases. In Figure 6, the model is used to determine what would happen if NPIs were only left in place for three weeks. The model shows the drop in R-number stalls and then starts to go back up, and predicted caseloads skyrocket.
Conclusion
The COVID-19 pandemic has challenged the life sciences community. It has prompted highly accelerated development programs in both vaccines and treatments and has had a major impact on non-COVID-19 clinical development programs. The WAVE model is a hybrid dynamic transmission model that leverages granular local data to forecast case numbers, accounting for the impact of NPIs and other interventions. It has supported enhanced site feasibility and ongoing monitoring of predicted case numbers for clinical development programs in both COVID-19 vaccines and treatments with the aim of increasing trial efficiency and reducing timelines to expedite the availability of these innovations.
For more information, please contact
[email protected] or [email protected]


